Introduction to Hypothesis Testing
Statistical Hypothesis Testing
Hypothesis testing is a statistical method used to evaluate a hypothesis or claim about a population parameter based on sample data. In hypothesis testing, we start with a null hypothesis (H0), which is a statement about the value of a population parameter that we want to test. We also have an alternative hypothesis (Ha), which is a statement that contradicts the null hypothesis and represents the possibility of an effect or difference.
Goal of hypothesis testing
The goal of hypothesis testing is to determine if there is enough evidence from the sample data to reject the null hypothesis in favor of the alternative hypothesis, or if we fail to reject the null hypothesis due to lack of evidence. This decision is based on the level of significance alpha (α) chosen, which is the probability of rejecting the null hypothesis when it is actually true.
In this tutorial we will compare data from a sample to a hypothesized parameter. In each case, we will compute the probability that a population with the specified parameter would produce a sample statistic as extreme or more extreme to the one we observed in our sample. This probability is known as the p-value and it is used to evaluate statistical significance.
- p-value
- Given that the null hypothesis is true, the probability of obtaining a sample statistic as extreme or more extreme than the one in the observed sample, in the direction of the alternative hypothesis
A test is considered to be statistically significant when the p-value is less than or equal to the level of significance, also known as the alpha (α) level. For this class, unless otherwise specified, α=0.05; this is the most frequently used alpha level in many fields.
To perform hypothesis testing, we first define the null and alternative hypotheses based on the research question and the sample data. Then, we choose a suitable statistical test and calculate a test statistic and its corresponding p-value. The p-value is the probability of observing a test statistic as extreme as, or more extreme than, the one calculated from the sample data, assuming that the null hypothesis is true. If the p-value is less than the level of significance (alpha), we reject the null hypothesis and conclude that there is sufficient evidence to support the alternative hypothesis. If the p-value is greater than alpha, we fail to reject the null hypothesis and conclude that there is not enough evidence to support the alternative hypothesis.
Hypothesis
A hypothesis is an assumption about a population parameter. It is a statement about the population that may or may not be true. Hypothesis testing aims to make a statistical conclusion about accepting or not accepting the hypothesis.
So, a statistical hypothesis is an assertion or conjecture concerning one or more populations. To prove that a hypothesis is true, or false, with absolute certainty, we would need absolute knowledge. That is, we would have to examine the entire population. Instead, hypothesis testing concerns on how to use a random sample to judge if it is evidence that supports or not the hypothesis.
Hypothesis testing is formulated in terms of two hypotheses:
- H0: the null hypothesis;
- HA: the alternate hypothesis
The null hypothesis (H0) often represents either a skeptical perspective or a claim to be tested. The alternative hypothesis (HA) represents an alternative claim under consideration and is often represented by a range of possible parameter values.
The skeptic will not reject the null hypothesis (H0), unless the evidence in favor of the alternative hypothesis (HA) is so strong that she rejects H0 in favor of HA.
Null Hypothesis (H0)
- Represents the status quo.
- The hypothesis that states there is no statistical significance between two variables in the hypothesis.
- Believed to be true unless there is overwhelming evidence to the contrary.
- It is the hypothesis the researcher is trying to disprove.
Example of Null Hypothesis (H0)
It is hypothesized that flowers watered with lemonade will grow faster than flowers watered with plain water.
Null hypothesis:
There is no statistically significant relationship between the type of water used and the growth of the flowers.
Alternative Hypothesis (HA)
- Inverse of the null hypothesis.
- States that there is a statistical significance between two variables.
- Holds true if the null hypothesis is rejected.
- Usually what the researcher thinks is true and is testing
Null hypothesis:
If one plant is fed lemonade for one month and another is fed plain water, there will be no difference in growth between the two plants.
Alternative Hypothesis:
If one plant is fed lemonade for one month and another is fed plain water, the plant that is fed lemonade will grow more than the plant that is fed plain water
In hypothesis testing, we want to test is if HA is “likely” true. So, there are two possible outcomes:
- Reject H0 and accept HA because of sufficient evidence in the sample in favor or HA;
- Do not reject H0 because of insufficient evidence to support HA.
Note:
Failure to reject H0 does not mean the null hypothesis is true. There is no formal outcome that says “accept H0.” It only means that we do not have sufficient evidence to support HA.
Example of Null Hypothesis (H0) and Alternative Hypothesis
In a jury trial the hypotheses are:
- H0: defendant is innocent;
- HA: defendant is guilty.
H0 (innocent) is rejected if Ha (guilty) is supported by evidence beyond “reasonable doubt.” Failure to reject H0 (prove guilty) does not imply innocence, only that the evidence is insufficient to reject it.
Hypothesis Testing via CI
Hypothesis testing via confidence intervals (CI) is a statistical method used to evaluate the strength of evidence for or against the null hypothesis (H0) based on the observed data. In this approach, we first define the null and alternative hypotheses based on the research question and the sample data. We then choose a suitable statistical test and calculate a confidence interval for the parameter of interest.
A confidence interval is a range of values that is likely to contain the true population parameter with a certain degree of confidence. The confidence level, typically 95%, represents the proportion of intervals that would contain the true parameter if the sampling process was repeated many times.
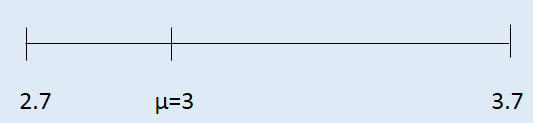
Earlier we calculated a 95% confidence interval for the average number of exclusive relationships college students have been in to be (2.7, 3.7). Based on this confidence interval, do these data support hypothesis that college students on average have been in more than 3 exclusive relationship.
Then our NULL Hypothesis will be will like this:
H0: µ = 3 College students have been in 3 exclusive relationships, on average.
HA: µ > 3 College students have been in more than 3 exclusive relationships, on average.
For this case, our intervals span from 2.7 to 3.7 and the null value µ=3 are actually included in the interval. And the interval says any value within this range could conceivably be the true population mean therefore we cannot reject the null hypothesis in favor of the alternative.
This is quick and dirty approach for hypothesis testing. However, it doesn’t tell us the likelihood of certain outcome under the null hypothesis. In the other words it does not tell us the p value.
Note:
We always do hypothesis testing for population parameters. We never hypothesized sample statistics.
Hypothesis testing via p-Value
Hypothesis testing via p-value is a statistical method used to evaluate the strength of evidence against the null hypothesis (H0) based on the observed data. In hypothesis testing via p-value, we first define the null and alternative hypotheses based on the research question and the sample data. We then choose a suitable statistical test and calculate a test statistic and its corresponding p-value.
The p-value is a way of quantifying the strength of the evidence against the null hypothesis and in favor of the alternative. Formally the p-value is a conditional probability.
he p-value is the probability of observing a test statistic as extreme as, or more extreme than, the one calculated from the sample data, assuming that the null hypothesis is true. The p-value is calculated using a statistical table or software, and is compared to the level of significance (alpha) chosen. If the p-value is less than alpha, we reject the null hypothesis and conclude that there is sufficient evidence to support the alternative hypothesis. If the p-value is greater than alpha, we fail to reject the null hypothesis and conclude that there is not enough evidence to support the alternative hypothesis.
The interpretation of the p-value depends on the level of significance chosen. If alpha is set to 0.05, for example, a p-value of less than 0.05 indicates that there is less than a 5% chance of observing the test statistic under the null hypothesis, and provides strong evidence against the null hypothesis. A p-value greater than 0.05, on the other hand, suggests that the observed data is likely to have occurred by chance, and provides weak or no evidence against the null hypothesis.
It is important to note that the p-value is not a measure of the magnitude of the effect or difference between the populations being tested. Rather, it is a measure of the strength of evidence against the null hypothesis, given the observed data. Additionally, hypothesis testing via p-value does not provide evidence in favor of the alternative hypothesis, but only provides evidence against the null hypothesis.
In summary, hypothesis testing via p-value is a useful statistical method to evaluate the strength of evidence against the null hypothesis based on the observed data. The p-value provides a measure of the likelihood of observing the test statistic under the null hypothesis, and is used to make informed decisions based on the observed data.
What is p-value?
The p-value is the probability of observing data at least as favorable to the alternative hypothesis as our current data set, if the null hypothesis is true. We typically use a summary statistic of the data, here the sample mean, to help compute the p-value and evaluate the hypotheses.
If we calculate the p-value for the same problem discussed in confidence interval section (Example 2).
P (Observed or more extreme outcome | H0 true) =?
When
N=50
¯x = 3.2
S= 1.74
SE= ![]() = 1.74/SQRT (50) = 0.246
= 1.74/SQRT (50) = 0.246
We are trying to find the value of P (¯x > 3.2 | H0: µ= 3) which is coming from null hypothesis.
Since we are assuming null hypothesis to be true, we can use that to construct the sampling distribution based on the Central Limit Theorem.
¯x ~ N (µ= 3, SE= 0.246) Here 3 is coming from null hypothesis as we are assuming null hypothesis is true. See the below picture, our area of interest for p-value is the red shaded area.

The Z-Score can be calculated by this formula
Test statistics, Z= (3.2-3)/0.246 = 0.81
p-value = P(Z > 0.81) = 0.209
- We use the test statistic to calculate the p-value, the probability of observing data at least as favorable to the alternative hypothesis as our current data, if the null hypothesis was true.
- If the p-value is low (lower than the significance level, α, which is usually 5 %) we say that it would be very unlikely to observe the data if the null hypothesis were true, and hence reject H0.
- If the p-value is high (higher than α) we say that it is likely to observe the data even if the null hypothesis were true, and hence do not reject H0.
Since p-value for this case is 0.209 and it is higher than 0.05, so we do not reject the null hypothesis.
What is that meaning context of this question? Our null hypothesis was that college student on average have 3 exclusive relationships vs the alternative hypothesis was college students have been in more than 3 exclusive relationships, on average. In this case, we fail to reject null hypothesis as we do not have enough evidence to reject null hypothesis. That sets the population average of number of exclusive relationships college student have been in to 3.
Interpretation of the p-value
The p-value is a measure of the strength of evidence against the null hypothesis (H0) based on the observed data. It represents the probability of observing a test statistic as extreme as, or more extreme than, the one calculated from the sample data, assuming that the null hypothesis is true. The interpretation of the p-value depends on the level of significance (alpha) chosen.
- If the p-value is less than alpha, typically 0.05, we reject the null hypothesis and conclude that there is sufficient evidence to support the alternative hypothesis (Ha). This means that the observed data is unlikely to have occurred by chance alone, and suggests that there is a statistically significant difference between the populations being tested. In other words, we can confidently say that there is evidence of an effect or difference, and it is not simply due to random chance.
- If the p-value is greater than alpha, we fail to reject the null hypothesis and conclude that there is not enough evidence to support the alternative hypothesis. This means that the observed data is likely to have occurred by chance, and suggests that there is no statistically significant difference between the populations being tested. However, it is important to note that failing to reject the null hypothesis does not necessarily mean that the null hypothesis is true, or that there is no effect or difference between the populations. It simply means that there is not enough evidence to support the alternative hypothesis based on the observed data.
- It is important to remember that the p-value is only one piece of information in the hypothesis testing process, and should be interpreted in conjunction with other factors, such as the effect size, sample size, and the validity of assumptions underlying the statistical test. Additionally, the interpretation of the p-value can be influenced by the choice of alpha level, and the p-value should not be used as the sole determinant of the significance of an effect or difference.
For the above example, if in fact college students have been in 3 exclusive relationships on average, there is a 21% chance that a random sample of 50 college students would yield a sample mean of 3.2 or higher. This is a pretty high probability, so we think that a sample mean of 3.2 or more exclusive relationships is likely to happen simply by chance.
How we made this decision?
- Since p-value is high(higher than 5%) we fail to reject H0.
- These data do not provide convincing evidence that college students have been in more than 3 relationship on average.
- The difference between the null value of 3 relationships and the observed sample mean of 32 relationship is due to chance or sampling variability.
Two-sided hypothesis testing with p-values
Two-sided hypothesis testing is a statistical method used to determine if there is evidence of a significant difference between two population means or proportions, without specifying the direction of the difference. In two-sided hypothesis testing, the null hypothesis (H0) states that there is no significant difference between the two population parameters, while the alternative hypothesis (Ha) states that there is a significant difference between them.
So often instead of looking for a divergence from the null in a specific direction, we might be interested in divergence in any direction. And we call such hypothesis tests two-sided (or two-tailed). The definition of a p-value is the same regardless of doing a one or two-sided test, however the calculation is slightly different since we need to consider “at least as extreme as the observed outcome” in both direction away from the mean.
For the above example if we want to do the two-sided hypothesis testing then we have to find P (¯x > 3.2 OR (¯x < 2.8 | H0: µ= 3).
How to we come up with 2.8?
As, 3.2-3=0.2
so, 3-0.2=2.8

p-value = P( Z > 0.81) + P( Z < -0.81)
= 2*0.209
=0.418